This is a suite of tools to measure different things about peoples' ability to perceive sound and music. The goal of these tools is to discover how certain auditory skills like pitch, tempo and balance can change with training or profession.
Currently there are 2 tools, the Tempo Drift Calculator designed to test someone's ability to keep a consistent tempo, and the Pan Tester which plays a series of tones on the left, right or center channel and asks the user which side they heard the strongest.
The Tempo Drift Calculator was supposed to be a quick and dirty project from when I was a senior in high school. I was tired of hearing complaining in marching band about how a certain section couldn't keep tempo properly, and wanted to have a friendly competition between the sections to see which section had the best timekeeping. However, I quickly learned that building a metronome is REALLY hard. What was supposed to be a simple while loop with a sleep statement, quickly became a deep dive into asynchronous functions and task schedulers. Eventually, a friend and I created a prototype that played a sound and then used the time delta from when the beep was supposed to play and when it actually played to correct for the next beep. This implementation took a few cycles to get consistent, but it worked pretty well. Unfortunately, I was graduating high school and I didn't have time to continue the project. Midway through the year following year however, I had some free time and decided to take another stab at it. The prototype we had made was no longer working, and after some unsuccessful attempts at fixing it, I was about ready to give up. I knew it was possible, there's a million apps and websites with metronomes, but clearly they all knew something I didn't. And then I found this project on GitHub that blew my mind. I'd used midi hundreds of times on other music projects where I was arranging songs, but I never thought to use it in my metronome. With the metronome hurdle cleared, the next challenge was trying to quantify the tempo drift. The user is given 4 measures to click along with the set tempo to help them internalize the pulse. Then because they should be tapping at the given bpm, the data is recorded as how much time (in ms) there were between when the user tapped and when the beat should have been. This delta can then be plotted where y = 0 is no variation. This is basically impossible to achieve though for technical reasons (response time and clock cycle variations) as well as physiological reasons (no one is a perfect metronome).
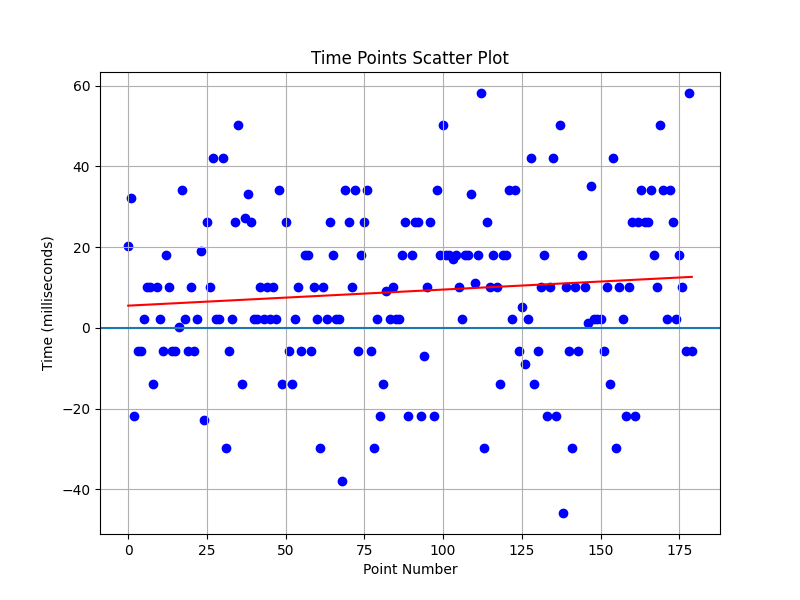
So how can these charts be contextualized? Based on a mildly anecdotal study by Shawn Crowder and a 2007 study from the University of Central Oklahoma, somewhere between 10 and 30ms is where humans can no longer detect the variation between pulses (phasing). For the purposes of this experiment, anything within ± 10 ms is considered perfect. Musicians* don't think about music in milliseconds though, so what does the graph below mean to a musician? In this sample I am tapping along to a tempo I heard ringing in my ears as I drift off to sleep at night, 164 beats per minute, the tempo of The Victors. By the end I'm tapping about 15ms faster, which equates to a tempo of about 171 bpm.

* Musician is a broad term which includes electronic music producers who often do think and work in ms but I'm using the word in the classical sense, sorry.


