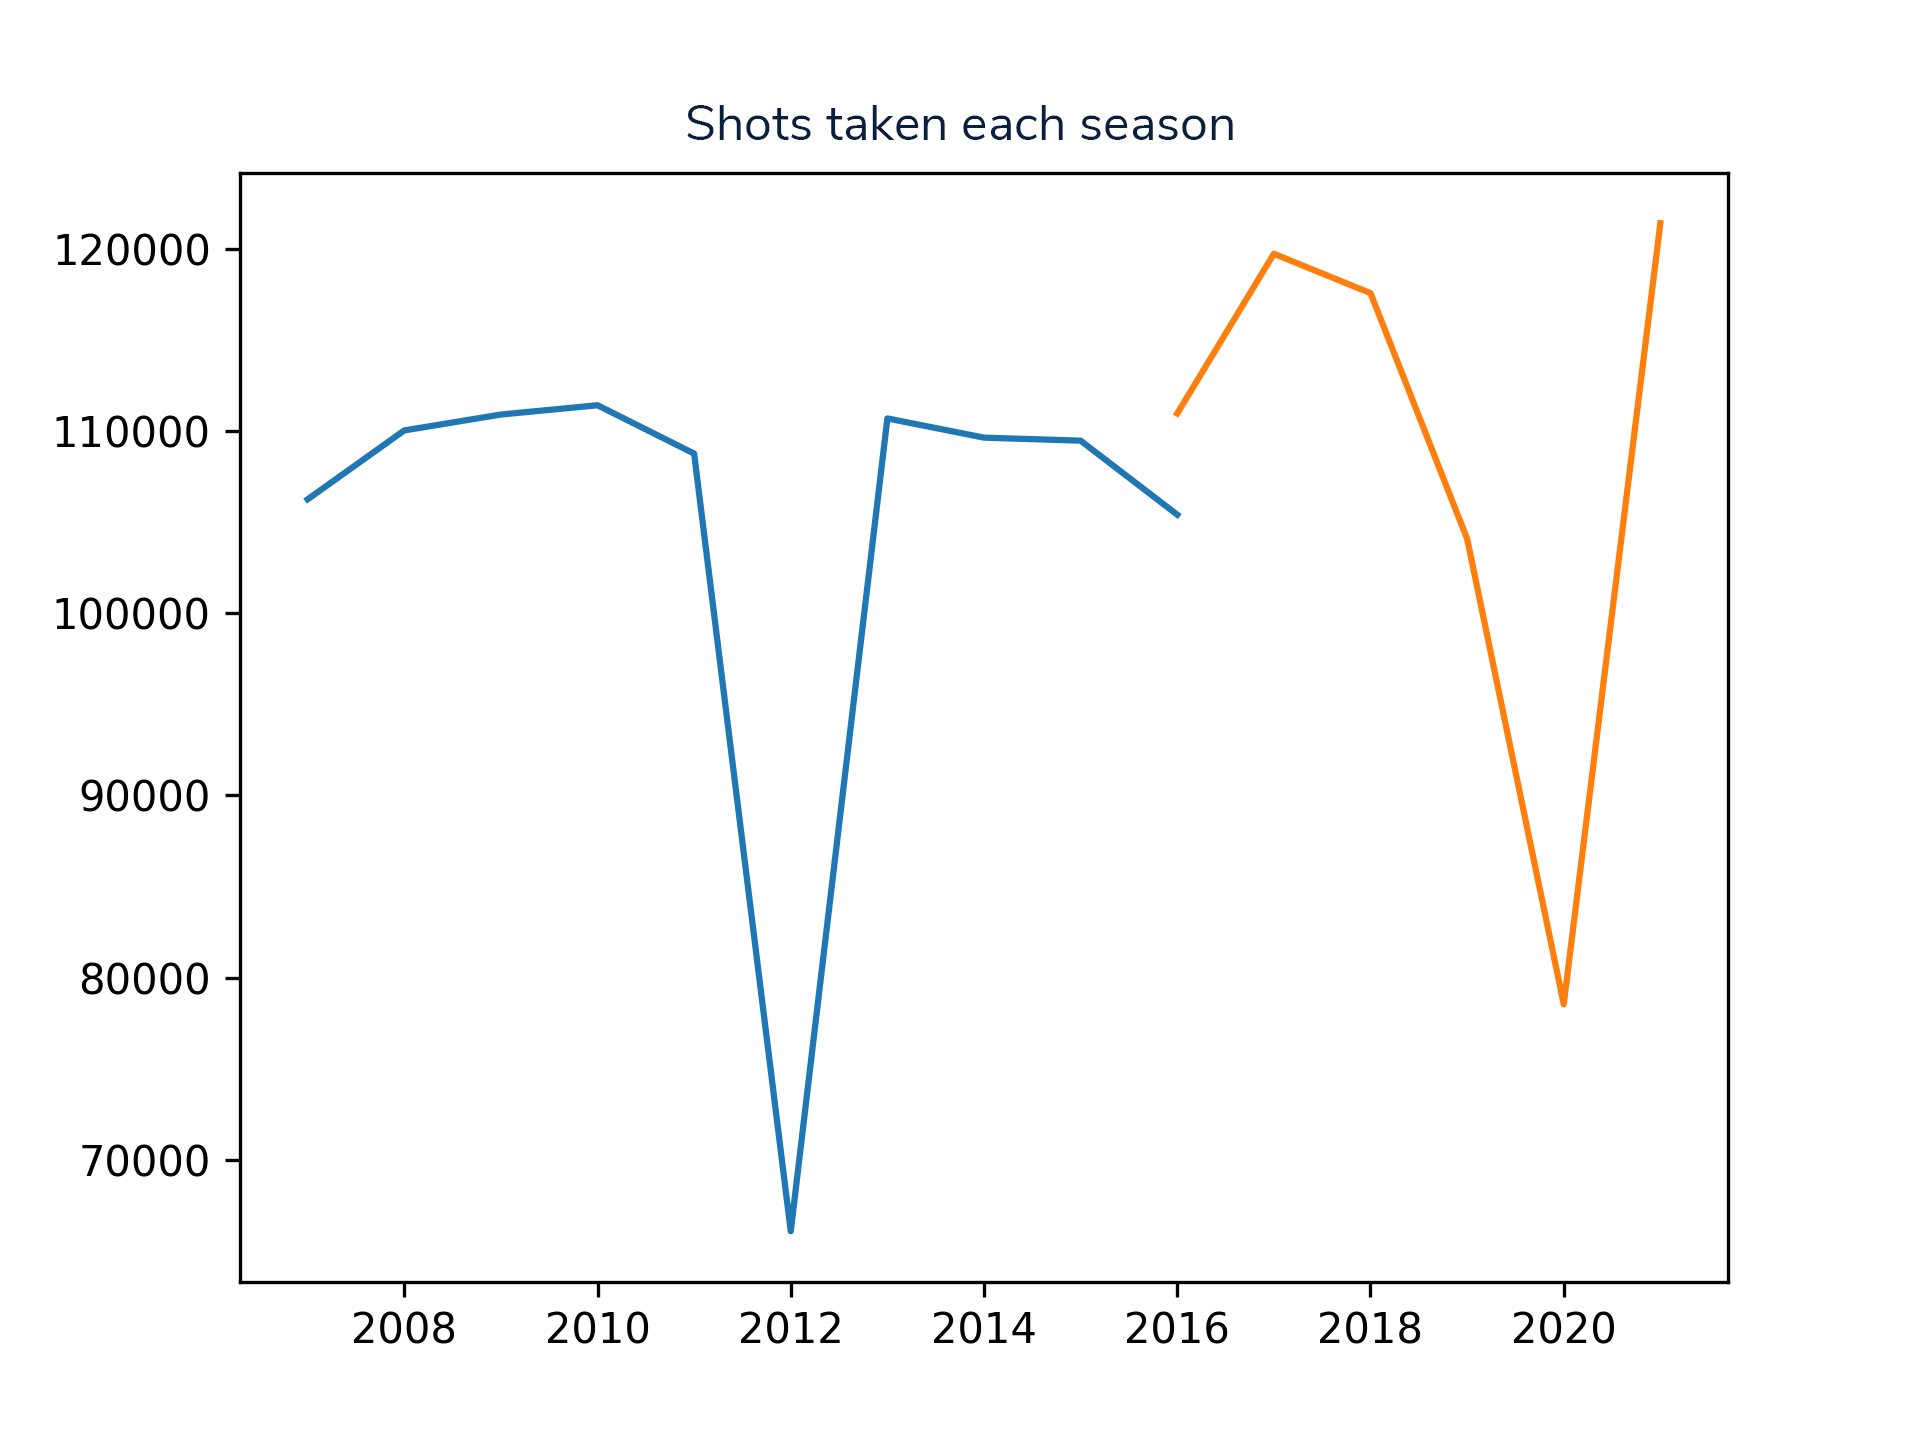
This was my first semester project for the Michigan Data Science Team. The MDST is divided into project groups, and the group that I joined was the Sport Science group. I picked this group because I was interested in the role of data in sports strategy and I wanted to learn more. Also unlike other project groups in the team, each member of the sports science group was working on an individual project with the group leader in a mentorship and teaching role. This let me experiment with python and pandas in a way that was structured like a class, but about I topic I was interested in.
I originally wanted to study the data behind alpine ski racing, but while researching that I learned a very important first lesson about data science: pretty much everything depends on the availability and quality of data, and for more niche sports, this was a problem. So instead I found a data set of NHL shots from 2007 to the present from Moneypuck.com and set about doing EDA on that data set.
This project provided me a fun way to learn more about the tools available to data scientists from the technical and code side, as well as from the mathematical and statistical side, learning about regression testing and other statistical tools in a way that was interesting to me. I also learned how to deal with incomplete or inconsistent data and the importance of being able to cross reference data to make sure that your initial data set is correct. I also learned about different ways to visualize data, and how different chart types are good for different situations.
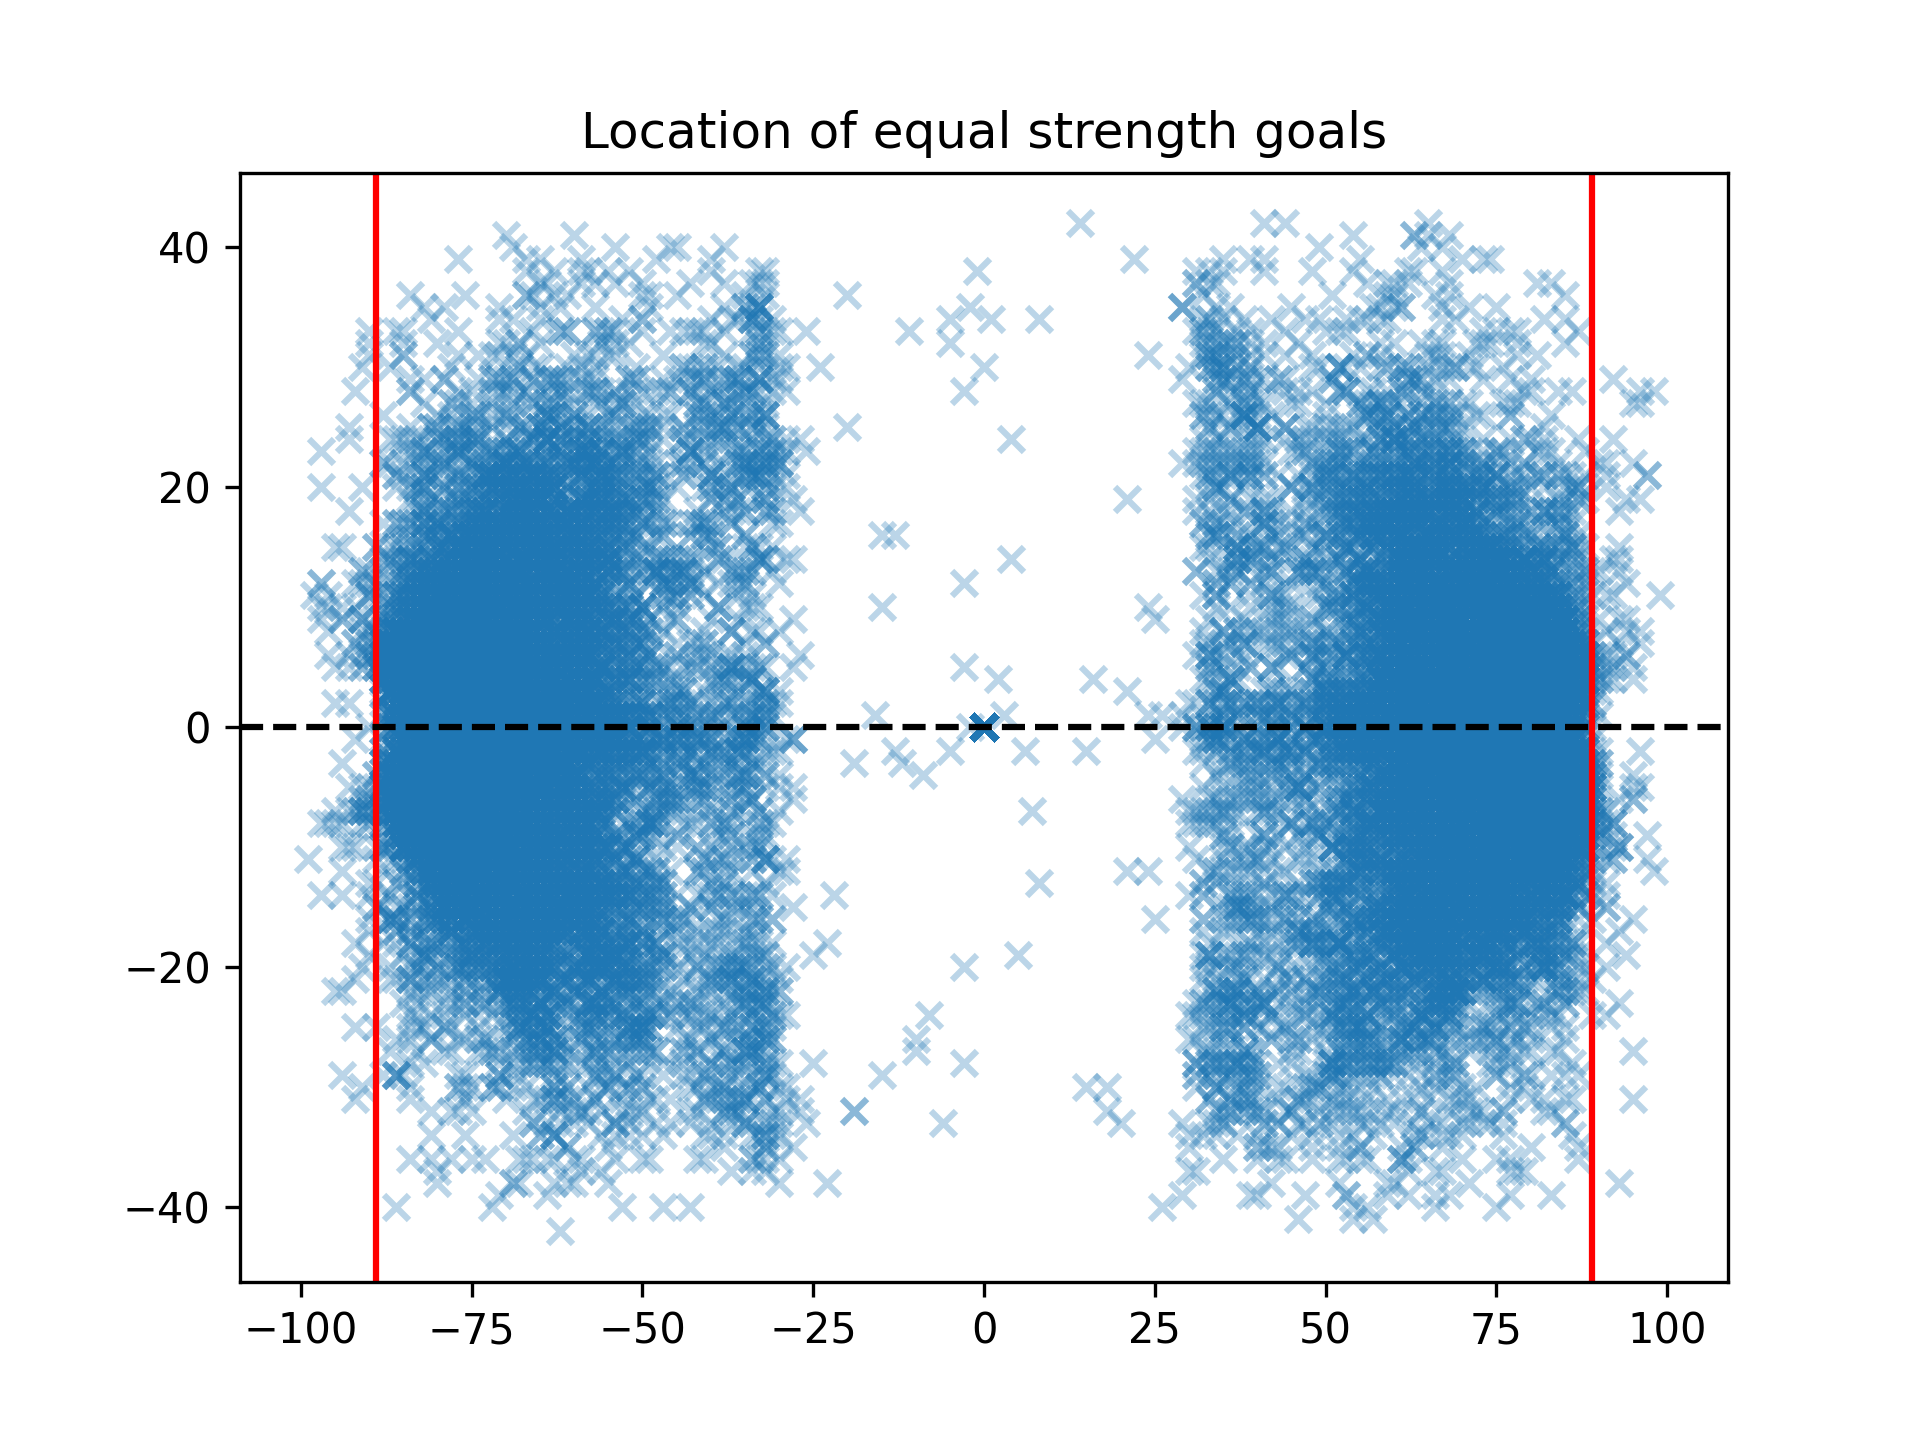
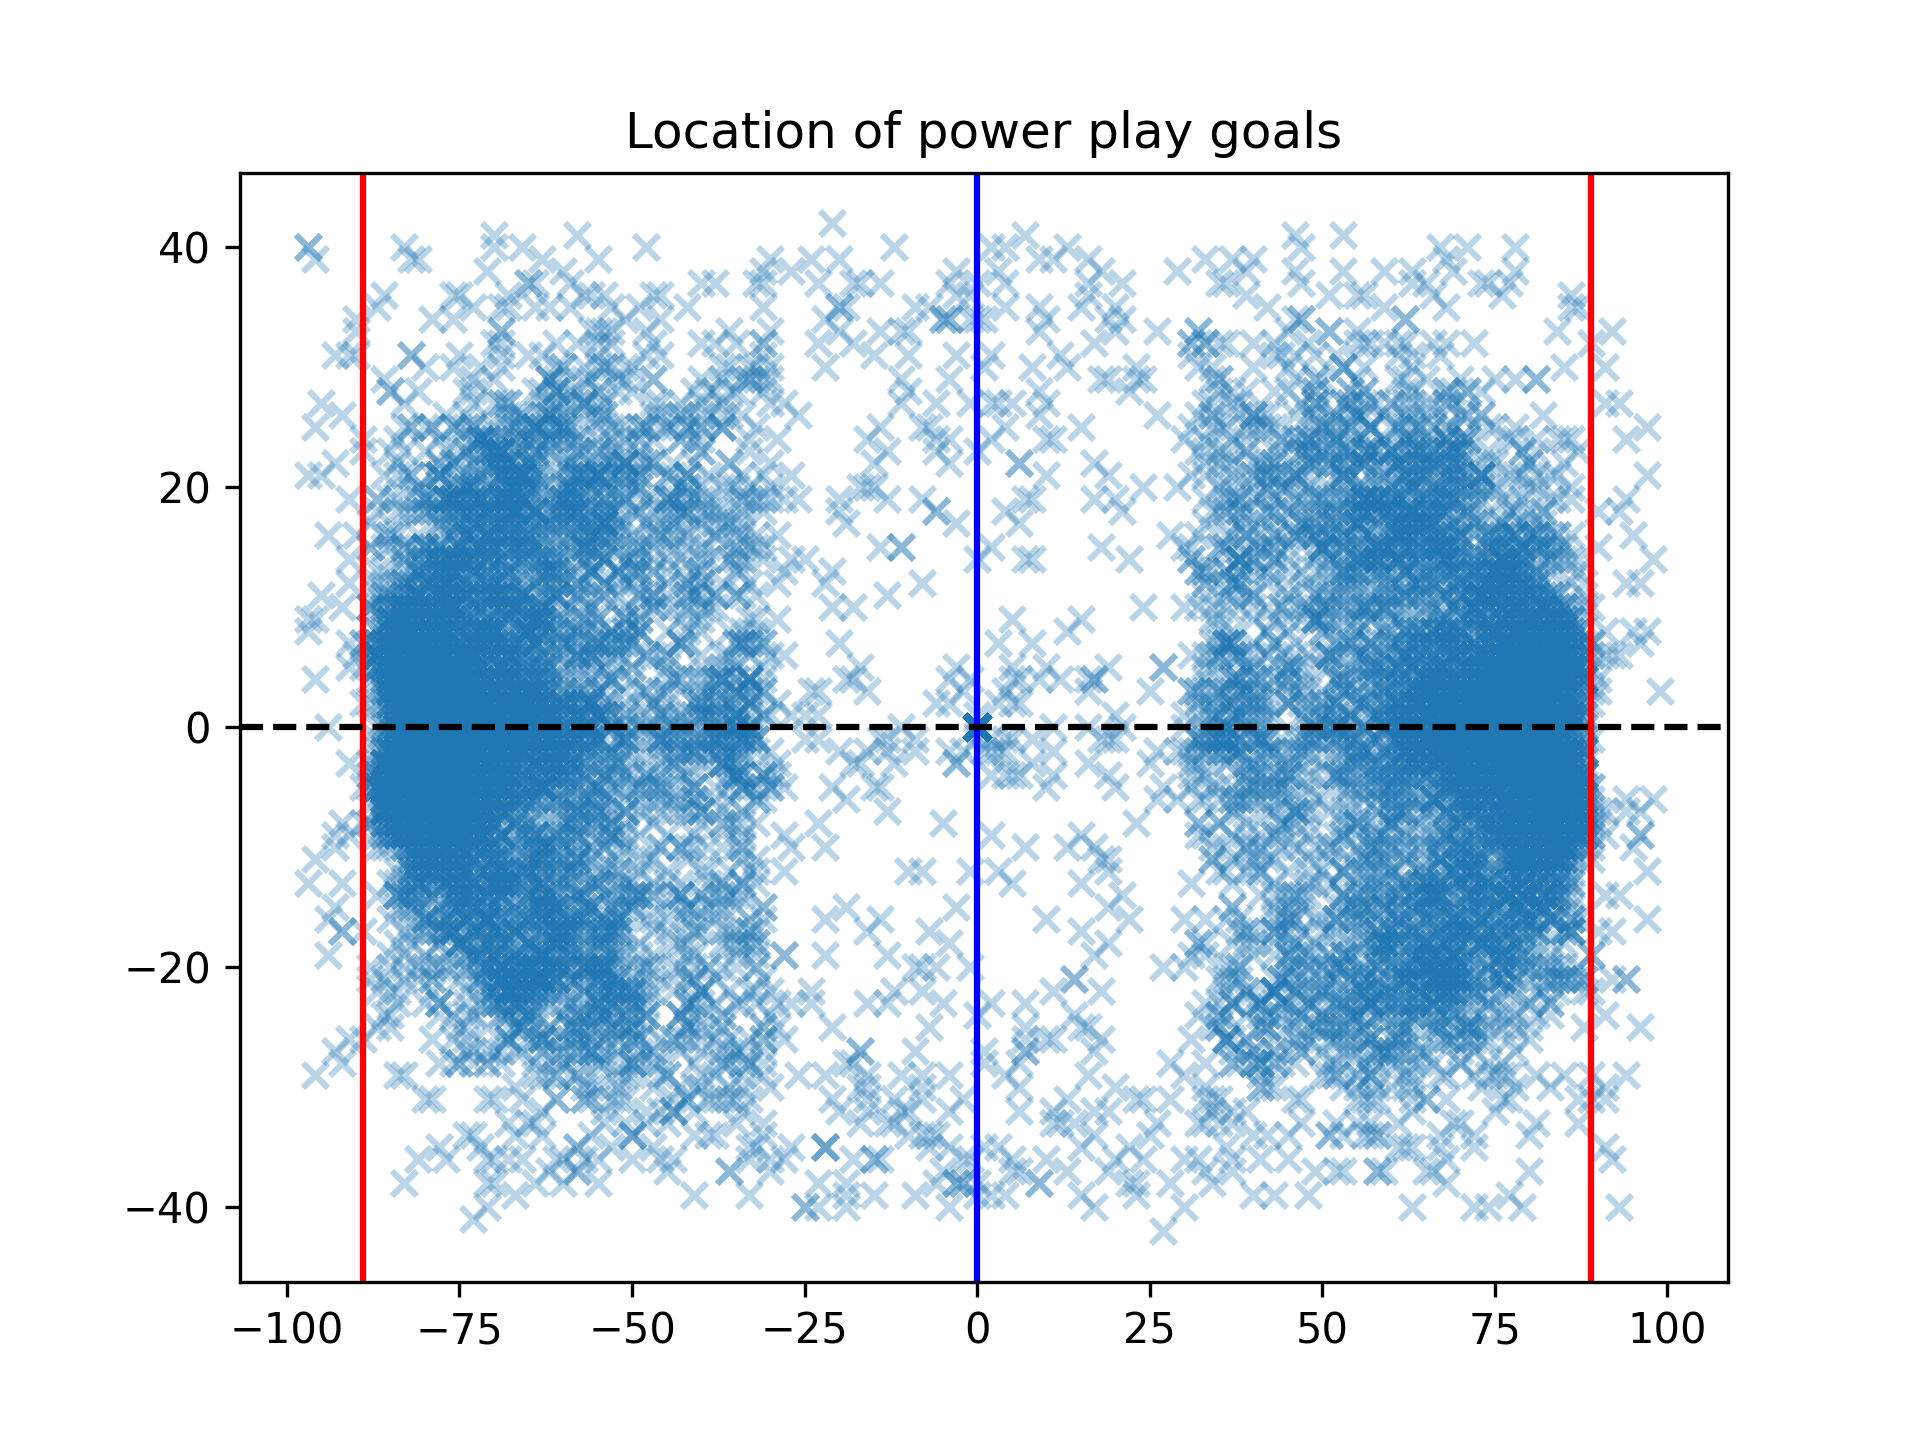
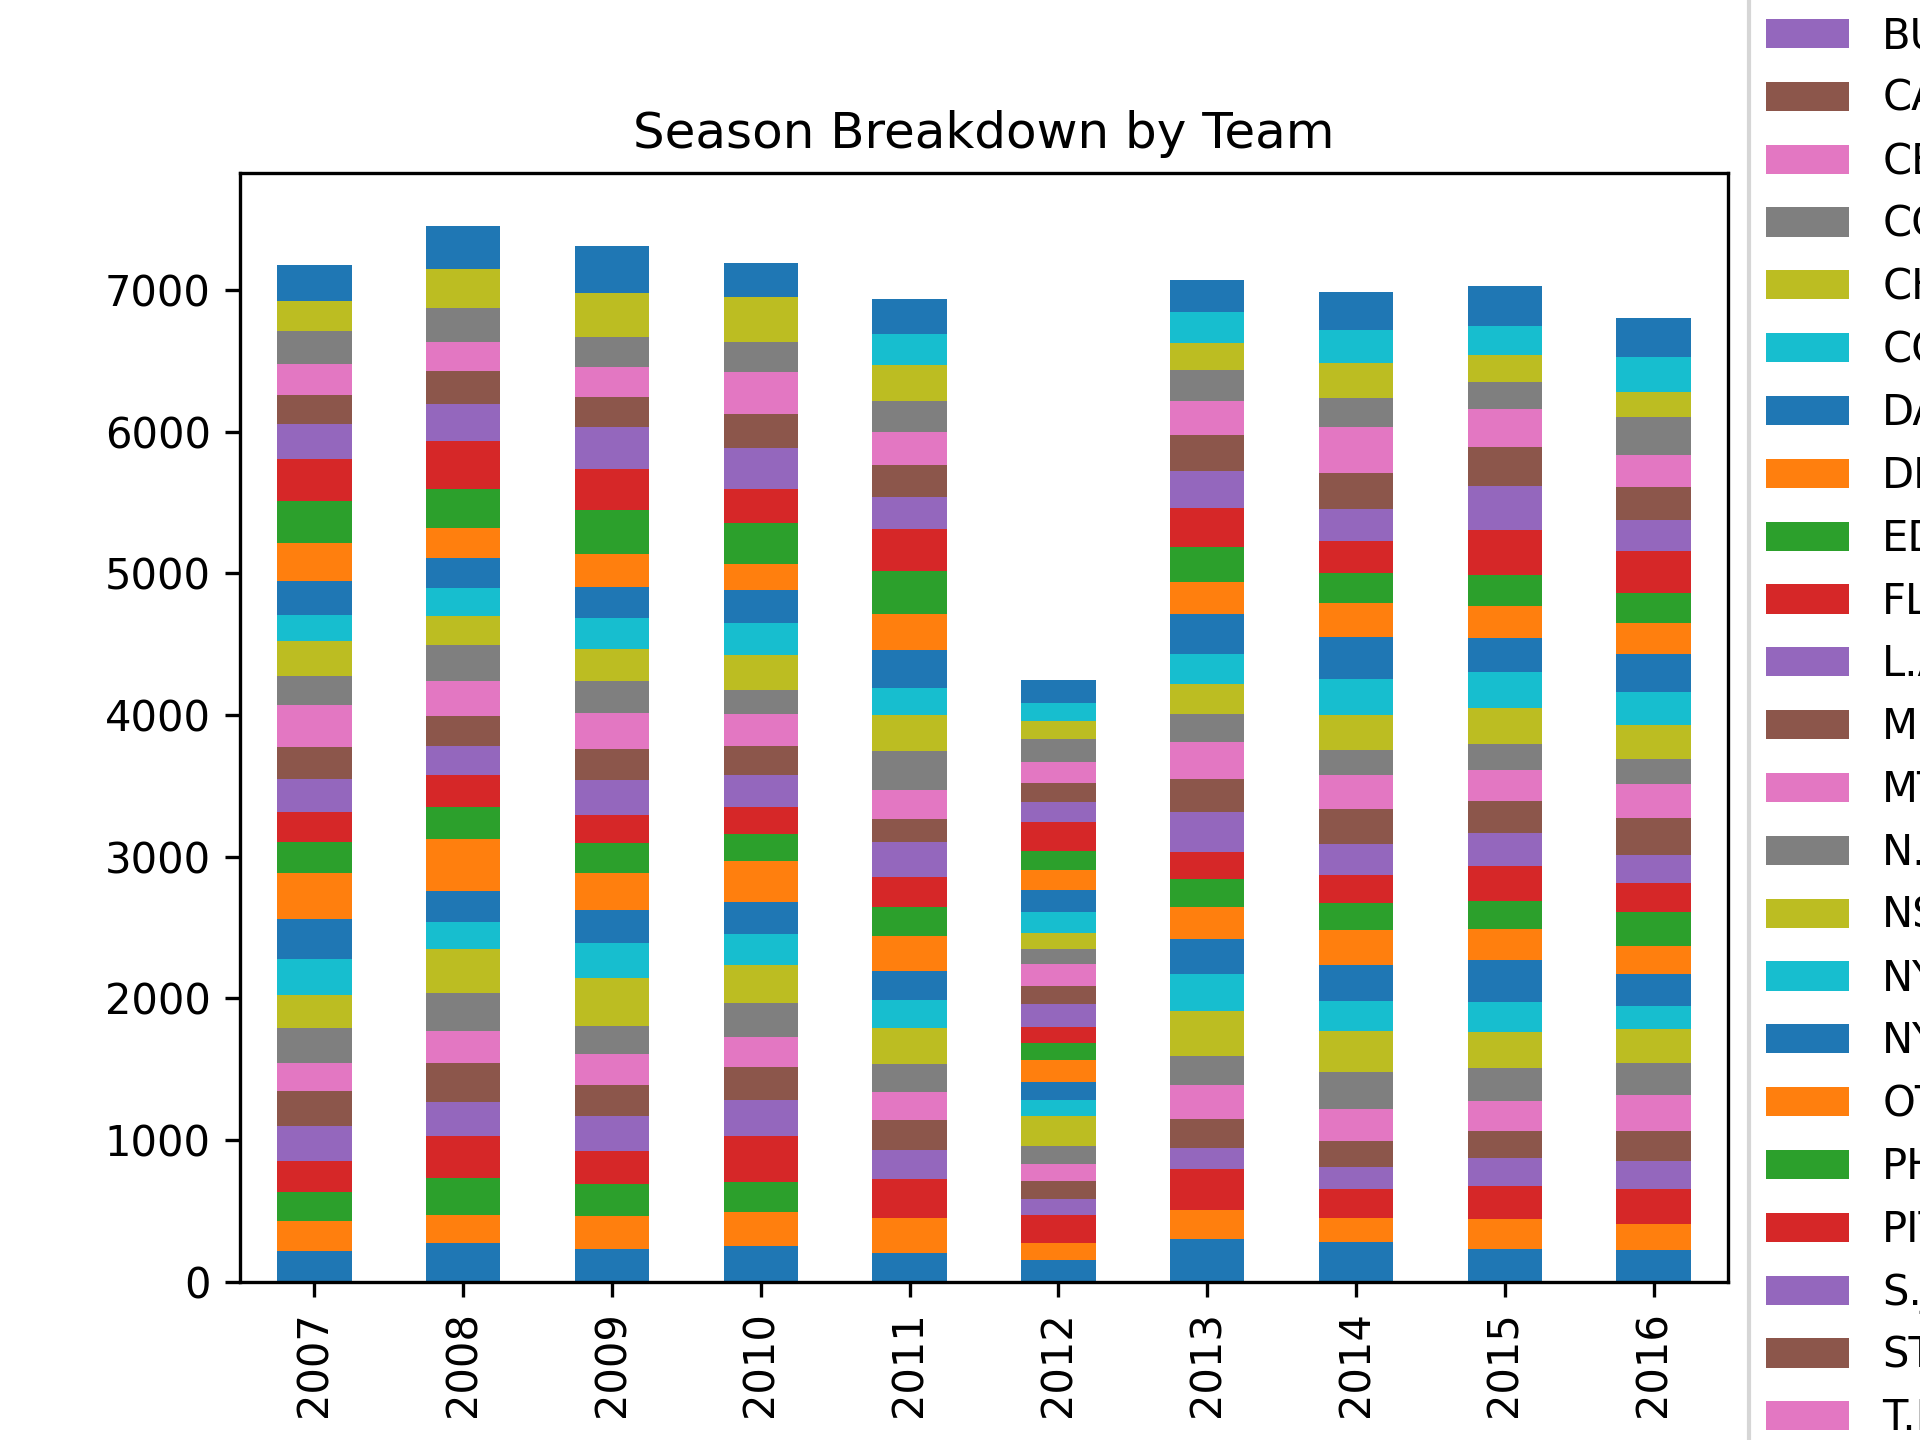
An example of a bad choice of chart for the situation
